Monitor Redpanda
Redpanda exports metrics through Prometheus endpoints for you to monitor system health and optimize system performance.
A Redpanda broker exports public metrics from the /public_metrics endpoint through the Admin API port (default: 9644).
Before v22.2, a Redpanda broker provided metrics only through the /metrics endpoint through the Admin API port. While Redpanda still provides this endpoint, it includes many internal metrics that are unnecessary for a typical Redpanda user to monitor. Consequently, the /public_metrics endpoint was added to provide a smaller set of important metrics that can be queried and ingested more quickly and inexpensively. The /metrics endpoint is now referred to as the 'internal metrics' endpoint, and Redpanda recommends that you use it for development, testing, and analysis.
|
Use /public_metrics for your primary dashboards for system health. Use /metrics for detailed analysis and debugging. |
|
To maximize monitoring performance by minimizing the cardinality of data, some metrics are exported when their underlying features are in use, and are not exported when not in use. For example, a metric for consumer groups, When monitoring internal metrics, consider enabling aggregate_metrics to reduce the cardinality of data to monitor. |
This topic covers the following about monitoring Redpanda metrics:
Configure Prometheus
Prometheus is a system monitoring and alerting tool. It collects and stores metrics as time-series data identified by a metric name and key/value pairs.
Redpanda Data recommends creating monitoring dashboards with /public_metrics.
|
To configure and use Prometheus to monitor Redpanda metrics:
-
Generate the configuration on an existing Prometheus instance.
-
For public metrics, run the command:
rpk generate prometheus-config -
For internal metrics, run the command:
rpk generate prometheus-config --internal-metricsWhen you run the command on a Redpanda broker, it displays other available brokers. To run the command on a machine that is not running Redpanda, you can either set the
--seed-addrflag to specify a remote Redpanda broker to discover the additional brokers, or set--node-addrswith a comma-separated list of known broker addresses. For example, use--node-addrs:rpk generate prometheus-config --job-name redpanda-metrics-test --node-addrs 172.31.18.239:9644,172.31.18.239:9643,172.31.18.239:9642
-
-
Edit the
prometheus.ymlfile in the Prometheus root folder to add the Redpanda configuration underscrape_configs. Customizetargetsfor the names and number of running brokers.scrape_configs: - job_name: redpanda-metrics-test static_configs: - targets: - redpanda-0:9644 - redpanda-1:9644 - redpanda-2:9644 metrics_path: /public_metrics -
Save the configuration file, and restart Prometheus to apply changes.
-
Observe in Prometheus that metrics from Redpanda endpoints are scraped.
Generate Grafana dashboard
Grafana is a tool to query, visualize, and generate alerts for metrics.
Redpanda supports generating Grafana dashboards from its metrics endpoints with rpk generate grafana-dashboard.
To generate a comprehensive Grafana dashboard, run the following command and pipe the output to a file that can be imported into Grafana:
rpk generate grafana-dashboard --datasource <name> --metrics-endpoint <url> > <output-file>-
<name>is the name of the Prometheus data source configured in your Grafana instance. -
<url>is the address to a Redpanda broker’s metrics endpoint (public or internal). -
For
/public_metrics, for example, run the following command:rpk generate grafana-dashboard \ --datasource prometheus \ --metrics-endpoint <broker-address>:9644/public_metrics > redpanda-dashboard.json -
For
/metrics, for example, run the following command:rpk generate grafana-dashboard \ --datasource prometheus \ --metrics-endpoint <broker-address>:9644/metrics > redpanda-dashboard.json
For details about the command, see rpk generate grafana-dashboard.
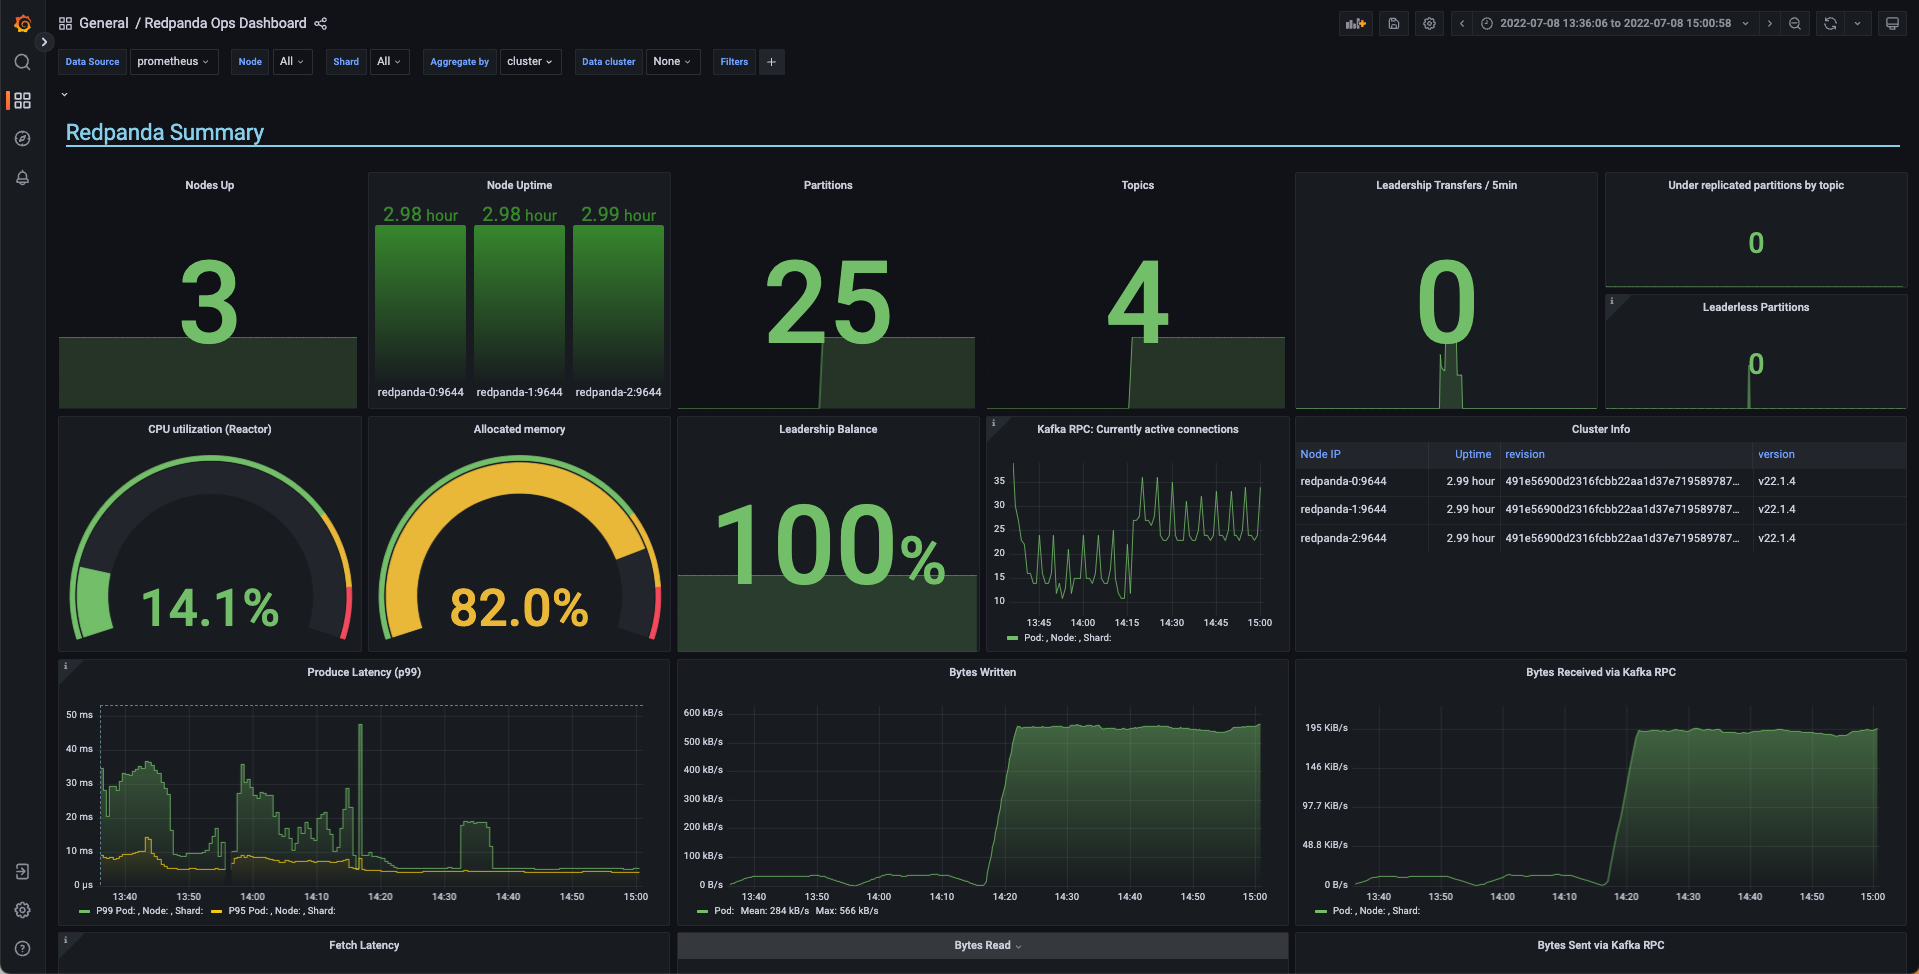
In Grafana, import the generated JSON file to create a dashboard. Out of the box, Grafana generates panels tracking latency for 50%, 95%, and 99% (based on the maximum latency set), throughput, and error segmentation by type.
To use the imported dashboard to create new panels:
-
Click + in the left pane, and select Add a new panel.
-
On the Query tab, select Prometheus data source.
-
Decide which metric you want to monitor, click Metrics browser, and type
redpandato show available public metrics (orvectorizedfor internal metrics) from the Redpanda cluster.
Use Redpanda monitoring examples
For hands-on learning, Redpanda provides a repository with examples of monitoring Redpanda with Prometheus and Grafana: redpanda-data/observability.
It includes example Grafana dashboards and a sandbox environment in which you launch a Dockerized Redpanda cluster and create a custom workload to monitor with dashboards.
Monitor for performance and health
This section provides guidelines and example queries using Redpanda’s public metrics to optimize your system’s performance and monitor its health.
| To help detect and mitigate anomalous system behaviors, capture baseline metrics of your healthy system at different stages (at start-up, under high load, in steady state) so you can set thresholds and alerts according to those baselines. |
Redpanda architecture
Understanding the unique aspects of Redpanda’s architecture and data path can improve your performance, debugging, and tuning skills:
-
Redpanda replicates partitions across brokers in a cluster using Raft, where each partition is a Raft consensus group. A message written from the Kafka API flows down to the Raft implementation layer that eventually directs it to a broker to be stored. Metrics about the Raft layer can reveal the health of partitions and data flowing within Redpanda.
-
Redpanda is designed with a thread-per-core model that it implements with the Seastar library. With each application thread pinned to a CPU core, when observing or analyzing the behavior of a specific application, monitor the relevant metrics with the label for the specific shard, if available.
Infrastructure resources
The underlying infrastructure of your system should have sufficient margins to handle peaks in processing, storage, and I/O loads. Monitor infrastructure health with the following queries.
CPU usage
For the total CPU uptime, monitor redpanda_uptime_seconds_total. Monitoring its rate of change with the following query can help detect unexpected dips in uptime:
rate(redpanda_uptime_seconds_total[5m])For the total CPU busy (non-idle) time, monitor redpanda_cpu_busy_seconds_total.
To detect unexpected idling, you can query the rate of change as a percentage of the shard that is in use at a given point in time.
rate(redpanda_cpu_busy_seconds_total[5m])|
While CPU utilization at the host-level might appear high (for example, 99-100% utilization) when I/O events like message arrival occur, the actual Redpanda process utilization is likely low. System-level metrics such as those provided by the This high host-level CPU utilization happens because Redpanda uses Seastar, which runs event loops on every core (also referred to as a reactor), constantly polling for the next task. This process never blocks and will increment clock ticks. It doesn’t necessarily mean that Redpanda is busy. Use |
Memory allocated
To monitor the percentage of memory allocated, use a formula with redpanda_memory_allocated_memory and redpanda_memory_free_memory:
sum(redpanda_memory_allocated_memory) / (sum(redpanda_memory_free_memory) + sum(redpanda_memory_allocated_memory))Disk used
To monitor the percentage of disk consumed, use a formula with redpanda_storage_disk_free_bytes and redpanda_storage_disk_total_bytes:
1 - (sum(redpanda_storage_disk_free_bytes) / sum(redpanda_storage_disk_total_bytes))Also monitor redpanda_storage_disk_free_space_alert for an alert when available disk space is low or degraded.
IOPS
For read and write I/O operations per second (IOPS), monitor the redpanda_io_queue_total_read_ops and redpanda_io_queue_total_write_ops counters:
rate(redpanda_io_queue_total_read_ops[5m]),
rate(redpanda_io_queue_total_write_ops[5m])
Throughput
While maximizing the rate of messages moving from producers to brokers then to consumers depends on tuning each of those components, the total throughput of all topics provides a system-level metric to monitor. When you observe abnormal, unhealthy spikes or dips in producer or consumer throughput, look for correlation with changes in the number of active connections (redpanda_rpc_active_connections) and logged errors to drill down to the root cause.
The total throughput of a cluster can be measured by the producer and consumer rates across all topics.
To observe the total producer and consumer rates of a cluster, monitor redpanda_kafka_request_bytes_total with the produce and consume labels, respectively.
Latency
Latency should be consistent between produce and fetch sides. It should also be consistent over time. Take periodic snapshots of produce and fetch latencies, including at upper percentiles (95%, 99%), and watch out for significant changes over a short duration.
In Redpanda, the latency of produce and fetch requests includes the latency of inter-broker RPCs that are born from Redpanda’s internal implementation using Raft.
Kafka consumer latency
To monitor Kafka consumer request latency, use the redpanda_kafka_request_latency_seconds histogram with the label redpanda_request="consume". For example, create a query for the 99th percentile:
histogram_quantile(0.99, sum(rate(redpanda_kafka_request_latency_seconds_bucket{redpanda_request="consume"}[5m])) by (le, provider, region, instance, namespace, pod))You can monitor the rate of Kafka consumer requests using redpanda_kafka_request_latency_seconds_count with the redpanda_request="consume" label:
rate(redpanda_kafka_request_latency_seconds_count{redpanda_request="consume"}[5m])
Kafka producer latency
To monitor Kafka producer request latency, use the redpanda_kafka_request_latency_seconds histogram with the redpanda_request="produce" label. For example, create a query for the 99th percentile:
histogram_quantile(0.99, sum(rate(redpanda_kafka_request_latency_seconds_bucket{redpanda_request="produce"}[5m])) by (le, provider, region, instance, namespace, pod))You can monitor the rate of Kafka producer requests with redpanda_kafka_request_latency_seconds_count with the redpanda_request="produce" label:
rate(redpanda_kafka_request_latency_seconds_count{redpanda_request="produce"}[5m])Internal RPC latency
To monitor Redpanda internal RPC latency, use the redpanda_rpc_request_latency_seconds histogram. For example, create a query for the 99th percentile latency:
histogram_quantile(0.99, (sum(rate(redpanda_rpc_request_latency_seconds_bucket[5m])) by (le, provider, region, instance, namespace, pod, redpanda_server)))You can monitor the rate of internal RPC requests with redpanda_rpc_request_latency_seconds histogram’s count:
rate(redpanda_rpc_request_latency_seconds_count[5m])Partition health
The health of Kafka partitions often reflects the health of the brokers that host them. Thus, when alerts occur for conditions such as under-replicated partitions or more frequent leadership transfers, check for unresponsive or unavailable brokers.
With Redpanda’s internal implementation of the Raft consensus protocol, the health of partitions is also reflected in any errors in the internal RPCs exchanged between Raft peers.
Leadership changes
Stable clusters have a consistent balance of leaders across all brokers, with few to no leadership transfers between brokers.
To observe changes in leadership, monitor the redpanda_raft_leadership_changes counter. For example, use a query to get the total rate of increase of leadership changes for a cluster:
sum(rate(redpanda_raft_leadership_changes[5m]))Under-replicated partitions
A healthy cluster has partition data fully replicated across its brokers.
An under-replicated partition is at higher risk of data loss. It also adds latency because messages must be replicated before being committed. To know when a partition isn’t fully replicated, create an alert for the redpanda_kafka_under_replicated_replicas gauge when it is greater than zero:
redpanda_kafka_under_replicated_replicas > 0Under-replication can be caused by unresponsive brokers. When an alert on redpanda_kafka_under_replicated_replicas is triggered, identify the problem brokers and examine their logs.
Leaderless partitions
A healthy cluster has a leader for every partition.
A partition without a leader cannot exchange messages with producers or consumers. To identify when a partition doesn’t have a leader, create an alert for the redpanda_cluster_unavailable_partitions gauge when it is greater than zero:
redpanda_cluster_unavailable_partitions > 0Leaderless partitions can be caused by unresponsive brokers. When an alert on redpanda_cluster_unavailable_partitions is triggered, identify the problem brokers and examine their logs.
Raft RPCs
Redpanda’s Raft implementation exchanges periodic status RPCs between a broker and its peers. The redpanda_node_status_rpcs_timed_out gauge increases when a status RPC times out for a peer, which indicates that a peer may be unresponsive and may lead to problems with partition replication that Raft manages. Monitor for non-zero values of this gauge, and correlate it with any logged errors or changes in partition replication.
Consumers
Consumer group lag
When working with Kafka consumer groups, the consumer group lag—the difference between the broker’s latest (max) offset and the group’s last committed offset—is a performance indicator of how fresh the data being consumed is. While higher lag for archival consumers is expected, high lag for real-time consumers could indicate that the consumers are overloaded and thus may need their topics to be partitioned more, or to spread the load to more consumers.
To monitor consumer group lag, create a query with the redpanda_kafka_max_offset and redpanda_kafka_consumer_group_committed_offset gauges:
max by(redpanda_namespace, redpanda_topic, redpanda_partition)(redpanda_kafka_max_offset{redpanda_namespace="kafka"}) - on(redpanda_topic, redpanda_partition) group_right max by(redpanda_group, redpanda_topic, redpanda_partition)(redpanda_kafka_consumer_group_committed_offset)Services
Monitor the health of specific Redpanda services with the following metrics.
Schema Registry
Schema Registry request latency:
histogram_quantile(0.99, (sum(rate(redpanda_schema_registry_request_latency_seconds_bucket[5m])) by (le, provider, region, instance, namespace, pod)))Schema Registry request rate:
rate(redpanda_schema_registry_request_latency_seconds_count[5m]) + sum without(redpanda_status)(rate(redpanda_schema_registry_request_errors_total[5m]))Schema Registry request error rate:
rate(redpanda_schema_registry_request_errors_total[5m])REST proxy
REST proxy request latency:
histogram_quantile(0.99, (sum(rate(redpanda_rest_proxy_request_latency_seconds_bucket[5m])) by (le, provider, region, instance, namespace, pod)))REST proxy request rate:
rate(redpanda_rest_proxy_request_latency_seconds_count[5m]) + sum without(redpanda_status)(rate(redpanda_rest_proxy_request_errors_total[5m]))REST proxy request error rate:
rate(redpanda_rest_proxy_request_errors_total[5m])